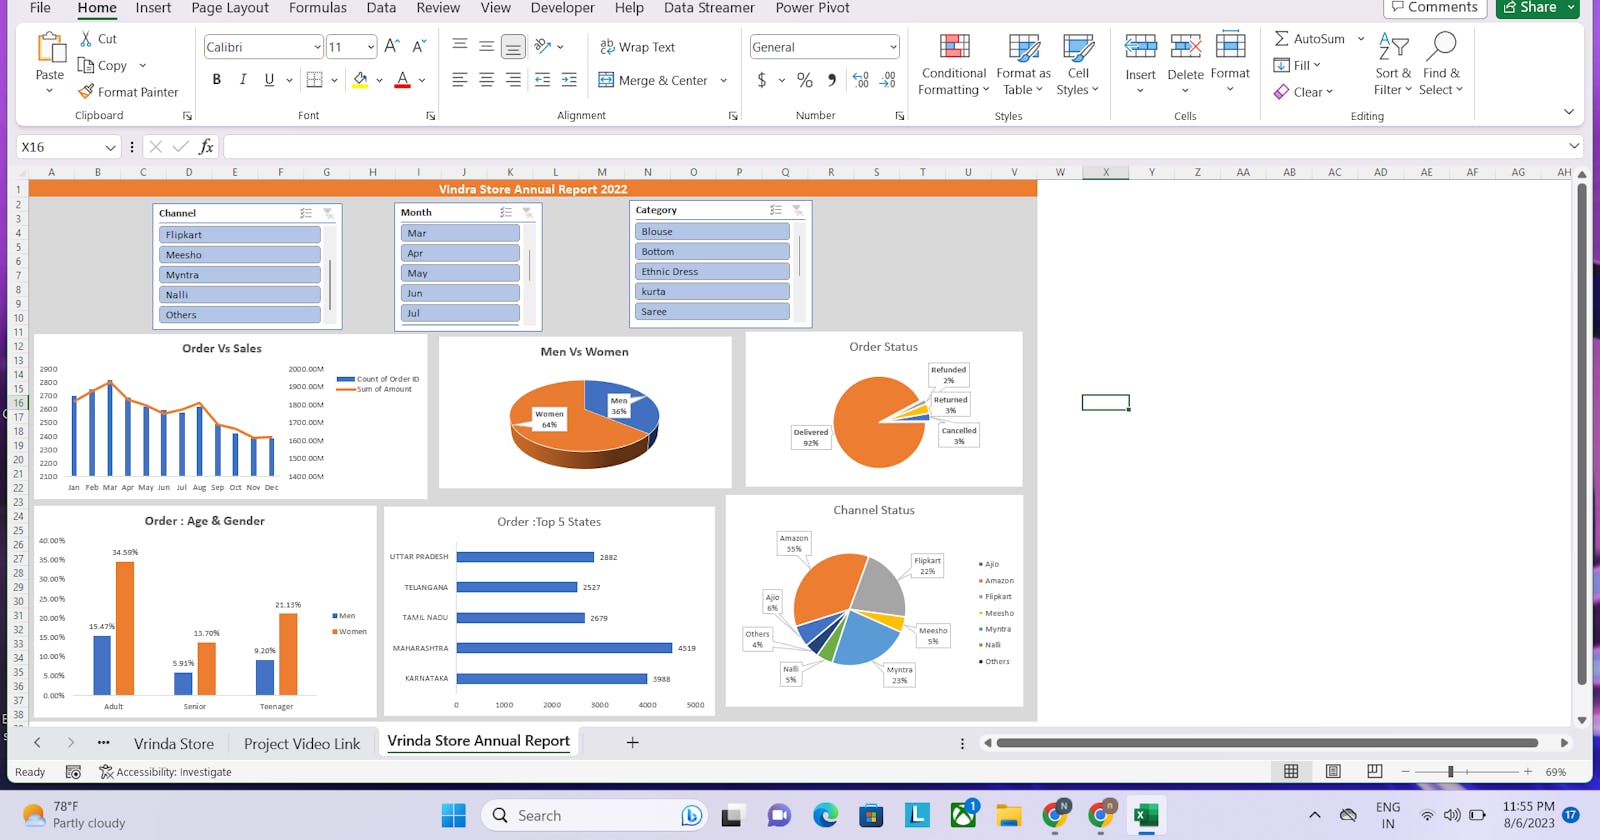
Introduction: In this blog, we will take you through a comprehensive data analysis and visualization project in the context of an e-commerce dataset using Microsoft Excel. The objective of this project is to gain meaningful insights from the data, which can help improve business strategies, optimize product offerings, and enhance overall customer experience. We will walk you through each step of the process, using simple language and actionable techniques to ensure that you can replicate the analysis for your own data sets.
Step 1: Data Acquisition and Understanding Before diving into the analysis, the first step is to acquire the e-commerce dataset and gain a thorough understanding of its contents. The data typically includes information such as product categories, customer demographics, purchase history, and more. By familiarizing ourselves with the dataset, we can determine which insights we want to extract.
Step 2: Data Cleaning and Preprocessing Data quality is crucial for accurate analysis, so we need to clean and preprocess the data. This involves handling missing values, removing duplicates, and converting data into a consistent format. By ensuring data integrity, we set the stage for reliable results.
Step 3: Exploratory Data Analysis (EDA) EDA involves visualizing and summarizing the main characteristics of the dataset. We will create simple charts like bar graphs, pie charts, and histograms to understand trends, distribution, and relationships within the data. EDA helps us identify patterns and potential outliers that may influence our analysis.
Step 4: Key Performance Indicators (KPIs) Identification Before delving deeper into the analysis, we need to define the key performance indicators (KPIs) that align with the e-commerce business goals. Examples of KPIs may include sales revenue, customer acquisition rate, conversion rate, and customer lifetime value (CLV). These KPIs will guide our analysis towards the most relevant insights.
Step 5: Segmentation Analysis Segmentation allows us to divide the customer base into groups based on shared characteristics. By segmenting customers, products, or regions, we can target specific groups with personalized marketing strategies and improve overall business efficiency.
Step 6: Trend Analysis and Forecasting Identifying trends in the data can help anticipate future demand and prepare the business for potential challenges. We will use Excel's trend analysis and forecasting functions to predict sales, inventory needs, and other essential metrics.
Step 7: Customer Behavior Analysis Understanding customer behavior is critical in e-commerce. We will analyze customer purchase patterns, preferences, and customer churn rates to enhance customer retention and loyalty strategies.
Step 8: Data Visualization for Decision-Making Excel offers a variety of powerful visualization tools, such as pivot tables, pivot charts, and slicers. We will create insightful visualizations to present the analyzed data in a clear and concise manner, making it easier for decision-makers to understand and act on the insights.
Conclusion: In this project, we demonstrated how to conduct data analysis and visualization for an e-commerce dataset using Microsoft Excel. By following the step-by-step approach, you can gain valuable insights that can drive business growth and improve customer satisfaction. Remember, data analysis is an iterative process, and continuous monitoring of your KPIs will help you stay ahead in the competitive e-commerce landscape. Happy analyzing!
Hope U find something useful. It's the 8th day of 75 data analysis if you have any queries comment down below.
